
Performance Reports: Clicks and Slots on WhatsApp
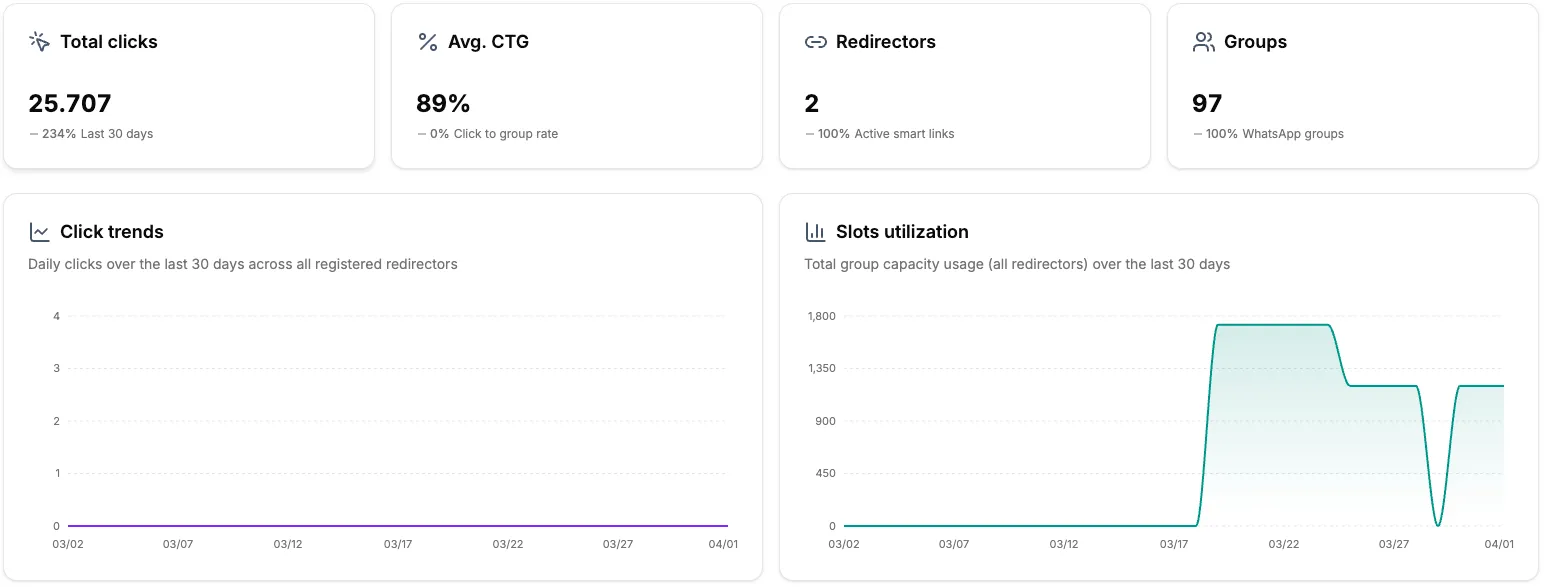
The Grupos Inteligentes analysis panel offers a clear and detailed view of your campaign performance. You can track important metrics like clicks, group occupancy rate, and compare the performance of your redirectors.
For signals and recommended actions from the last 30 days, see the Smart Report, available on the Scale plan.
How to Access Analysis
Section titled “How to Access Analysis”Overview (Dashboard)
Section titled “Overview (Dashboard)”- Access the main panel page at app.gruposinteligentes.com/dashboard.
- On the initial screen, you can already see a summary with the main metrics from all your redirectors.
Detailed Analysis by Redirector
Section titled “Detailed Analysis by Redirector”- Navigate to the Redirectors section.
- Choose the redirector you want to analyze and click on View details.
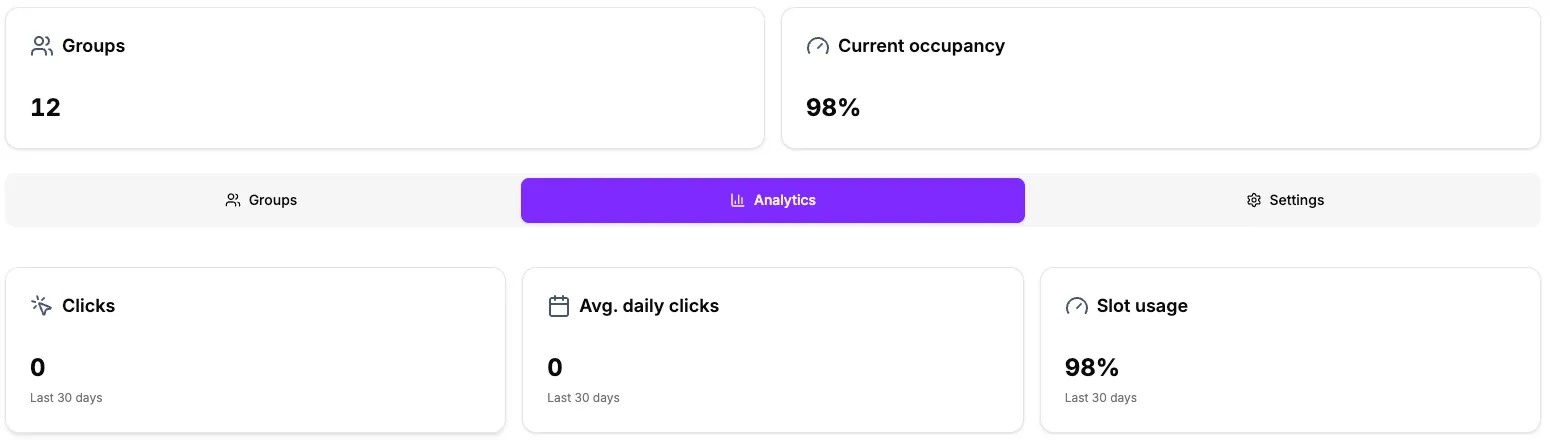
- Access the Analytics tab to see specific metrics.
Available Metrics
Section titled “Available Metrics”Overview (Dashboard)
Section titled “Overview (Dashboard)”| Metric | What it means |
|---|---|
| Total Clicks | Number of times your links were accessed in the last 30 days |
| Average CTR | Average clicks per group — helps compare your traffic with your number of groups |
| Active Redirectors | Number of redirectors that received at least one click |
| Total Groups | Total number of WhatsApp groups registered in your account |

Analysis by Redirector
Section titled “Analysis by Redirector”| Metric | What it means |
|---|---|
| Total Clicks | Clicks on the redirector in the selected period |
| Daily Average Clicks | Average clicks per day — the higher, the more constant the flow |
| Slot Usage | Increase in filled slots during the period, limited to total capacity |
| Churn Rate | Percentage of participants who left the groups |
| Lost Slots | Total slots lost to churn in the period |
Select Analysis Period
Section titled “Select Analysis Period”In the analysis by redirector, you can choose the desired period:
- Last 24 hours — For real-time monitoring (Scale)
- Last 7 days — To see the most recent performance
- Last 30 days — Default period, good for monthly analysis
- Last 90 days — To identify long-term trends
Simply click the period selector located at the top of the analytics tab.
Interpreting Charts
Section titled “Interpreting Charts”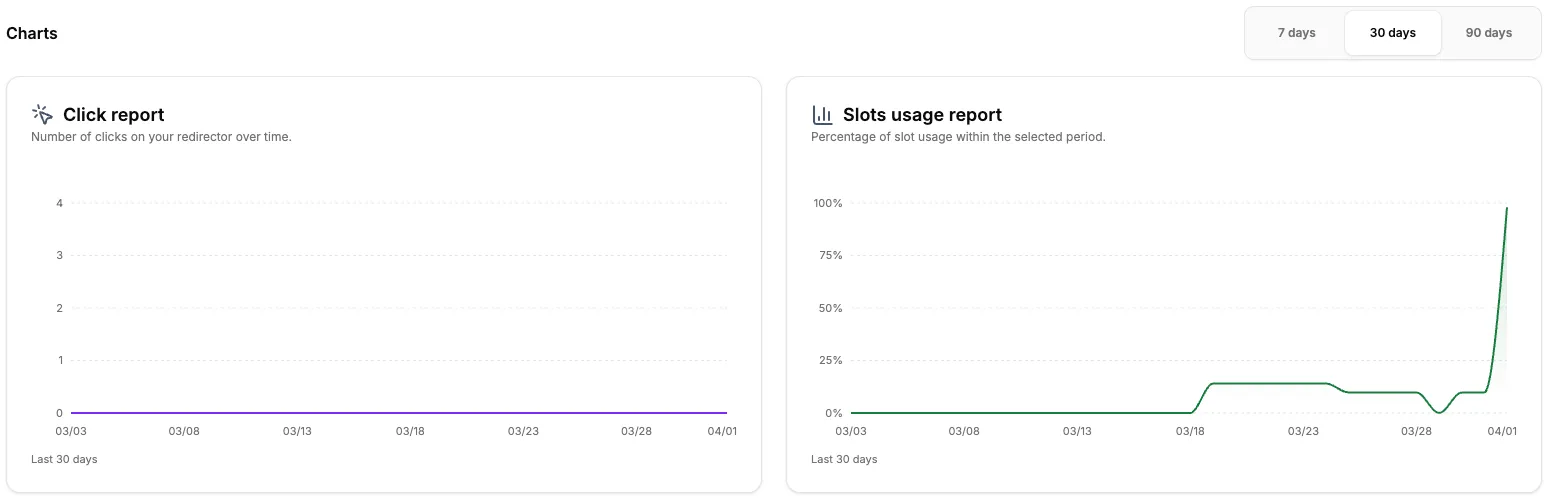
Click Chart
Section titled “Click Chart”Shows the click trend over time. Use this chart to:
- Identify days or times with higher access peaks
- Evaluate the impact of campaigns or promotions
- Compare performance between different periods
Slot Usage Chart
Section titled “Slot Usage Chart”Shows the history of your groups’ occupancy in the selected period. Use this chart to:
- Track the real growth of your member base
- Compare the click trend with slot usage
- Plan when to add new groups
Churn Report
Section titled “Churn Report”The churn report shows the rate at which participants leave your groups over time. With it, you can:
- Identify periods with high churn rates
- Evaluate whether your groups are retaining members
- Make decisions to reduce participant loss
Reports are available on Starter, Pro, and Scale plans.
Lead Reports
Section titled “Lead Reports”Track leads captured by the waitlist with detailed reports:
- By device: mobile, desktop, or tablet
- By location: lead’s country and city
- By UTM: which campaign and source brought the lead
- Timeline: when leads were captured
For more details, see the waitlist and lead capture guide.
Common Analysis Scenarios
Section titled “Common Analysis Scenarios”| Situation | What may be happening |
|---|---|
| Many clicks, few filled slots | Visitors are accessing the link but not joining the group. Check if the redirection message is clear. |
| Slots higher than clicks | You added members manually or there are accesses through other channels outside the redirector. |
| Click spikes | Success in a campaign, post, or promotion. |
| Low CTR | Your groups may have low available capacity or the link may not be displayed properly. |
Tips to Improve Your Results
Section titled “Tips to Improve Your Results”- Monitor regularly — Check your metrics at least once a week to identify trends.
- Compare periods — Use the 90-day selector to understand if your numbers are improving or worsening.
- Use the ranking — The ranking of most clicked redirectors helps identify which ones are performing best.
- Plan new groups — When occupancy is high, it’s time to add more groups so you don’t lose leads.
- Track your leads — Use lead reports to understand where your visitors come from and optimize your campaigns.